Part 5 – Improve endpoint user experience with Microsoft Endpoint Analytics: Application Reliability & Device Restarts


Leading up to Ignite, Microsoft announced a major update on Endpoint Analytics with Application Reliability & Restart Frequency. With the initial release of Endpoint Analytics you are able to improve user productivity and reducing IT costs by giving you insights about device setup, startup- & sign-in times and overall system performance. With the introduction of Application Reliability & Restart Frequency, intelligent endpoint management is taken to the next level with Endpoint Analytics.
In this 5th post about Endpoint Analytics I’m thrilled to introduce you Application Reliability. As the name implies, it provides you insights about the reliability of applications installed on your endpoints (Windows 10) managed by Microsoft Endpoint Manager (Configuration Manager), and how there reliability relates to hardware and operating systems. With the greatest of ease you identify application issues, for example by how often they crash or hang. Furthermore we’ll cover another great feature introduced with this major update release, which is Restart Frequency.
Application Reliability
Application reliability score consists of the following indicators related to applications:
- App performance – offers insight into the application landscape.
- Model performance – relationship between reliability & used hardware models.
- Device performance – offers insight into application reliability at device level.
- OS versions performance – relationship between reliability OS versions.
App performance
This section provides an overview of applications being used on your clients managed by Microsoft Endpoint Manager (Configuration Manager) within your tenant. Application reliability score is a relative score calculated using the frequency of crashes and the number of applications being used on a scale from 0 to 100 where the higher the score, the more reliable the application and vice versa.

By sorting columns ‘App reliability score’, ‘Total crashes’ or ‘Mean time to failure’ you can easily identify your unreliable applications and interpret these insights according importance & priority. As an example the ‘ssoengine.exe’ is found on 104 devices, however the application has crashed only once in the past 14 days. Drill down to the application you have more detailed insights regarding application versions and how the application reliability relatively relates to a particular OS version.

Sort by ‘Total crashes’ give you another dimension to track unreliable applications, however the number of crashes in the example below. However ‘SearchUI.exe’ is relative not that unreliable as the install base is larger compared to for example ‘MicrosoftEdgeCP.exe’ which puts this application in a more urgent perspective than ‘SearchUI.exe’.

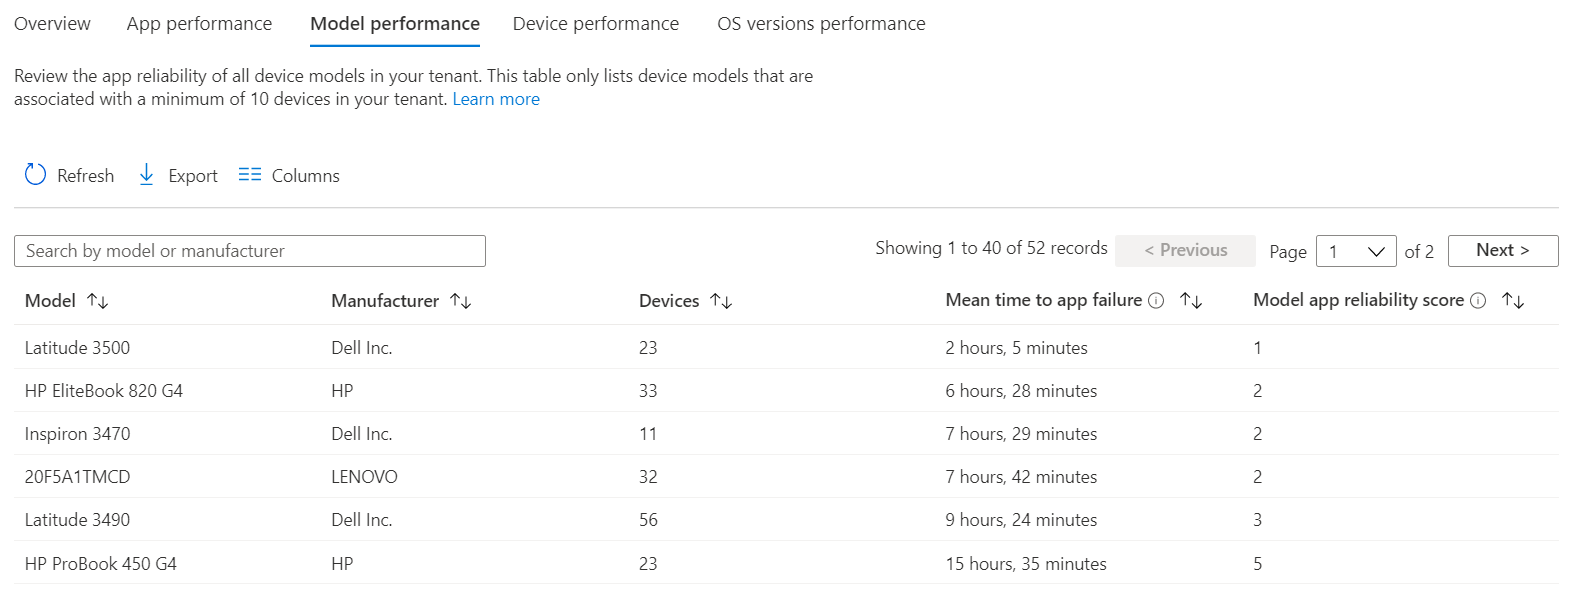
Model performance
The model performance table only lists device models that are associated with a minimum of 10 devices in your tenant and provide you a weighted score per model. This relates application reliability to a particular model being used in your organization which might be not a good match.
Device performance
Along the axis of device performance, you can specifically identify workplaces where applications regularly crashes and thus take action on an individual level. Taking a top 10 app crashes gives you a good start to mitigate issues by reinstalling or upgrading the application or refresh your device with an Autopilot Reset or clean install.

Drilling down to the Application Reliability tab, the timeline provides a clear overview of application events (crash or hang) over time. With this you can determine when and to what extent which application has a problem. You can isolate the problem to a specific application or conclude that the workplace itself is unreliable and this has repercussions on multiple applications.

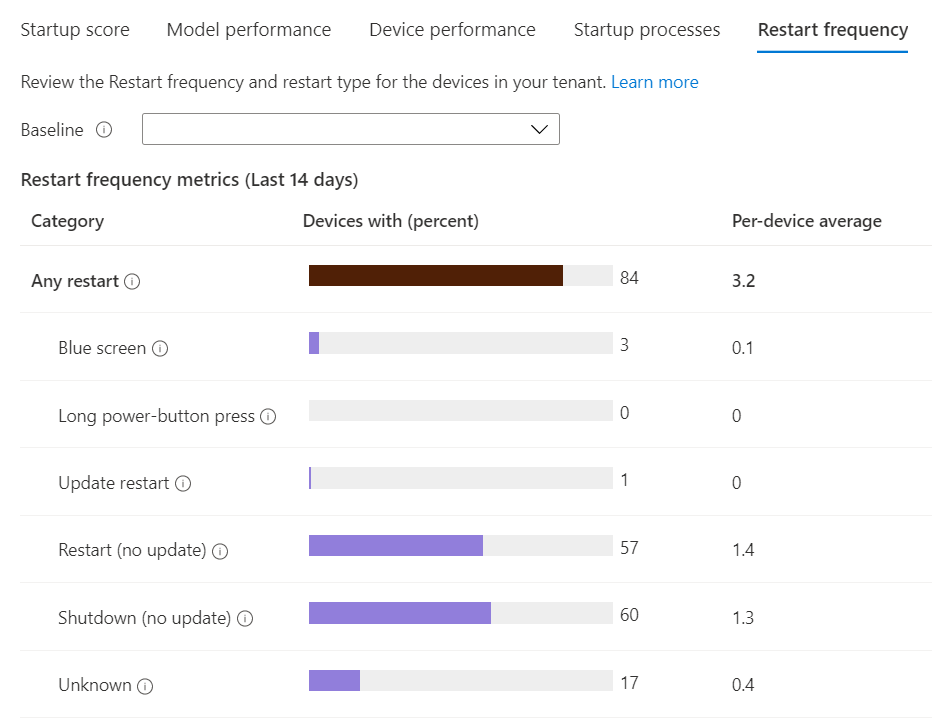
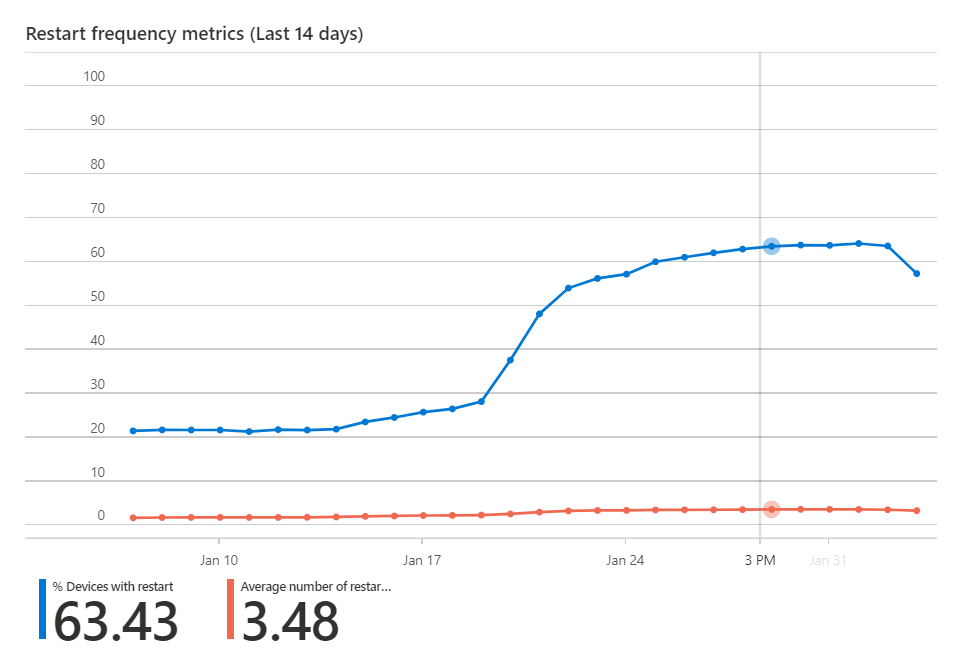
Restart Frequency
Another great feature as part of this service update release is Restart Frequency. Restart frequency provides you insights of your restart patterns like frequency and the type of restarts related to updates, regular restart or shutdown (expected). Another interesting category are the unexpected restarts like blue screens or other unknown reasons.
Both categories reboot (expected) and blue screens (unexpected) can be found as extra columns in both Device performance and Startup processes tabs, part of Startup performance. By sorting on these columns you can easily identity top 10 of endpoints with most restarts or even more interesting, with most blue screens.

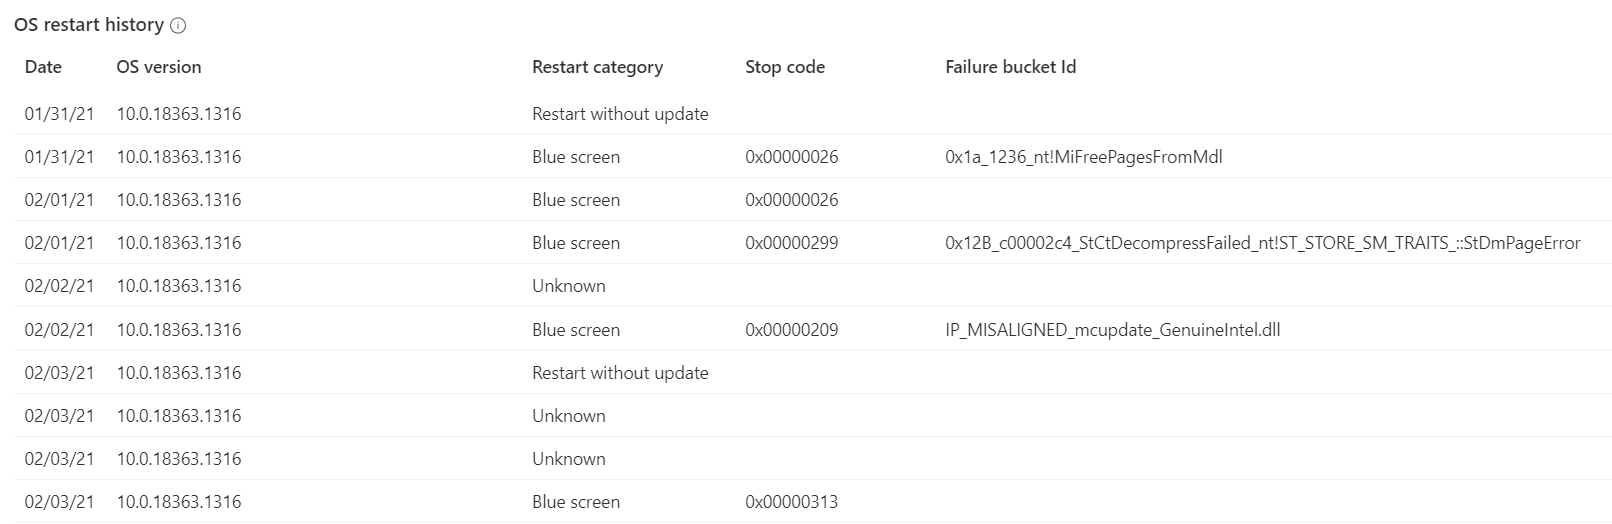
When drilling into device level the potential root cause can easily be identified for which appropriate follow-up actions can be carried out, varying from a driver update or refresh your endpoint with an Autopilot Reset or clean install..
Summary
With Endpoint Analytics we are able to denote user- and technology experience with a score and thereby make it transparent and measurable for your organization. Think of a targeted device refresh in case of boot performance issues or unexpected reboots (blue screen), updating or reinstalling unreliable applications and remediate issues before they impacts your end-users.
Endpoint Analytics is available for those having a Microsoft Endpoint Manager license (Microsoft 365 E3 or Enterprise Mobility + Security E3) and requires Windows E3 SKU for using Proactive Remediation (remediation scripting). From here you’re just one click away from Endpoint Analytics 😉 http://aka.ms/endpointanalytics
Sources
- Microsoft Endpoint Analytics overview https://docs.microsoft.com/en-us/mem/analytics/overview
- Application Reliability https://docs.microsoft.com/en-us/mem/analytics/app-reliability
- Restart frequency Endpoint Analytics https://docs.microsoft.com/en-us/mem/analytics/restart-frequency
Endpoint Analytics series
In a series of blog posts I’ll show you the possibilities of endpoint analytics, where to start, how does it works and most important to get the most out of it for your end-users and (IT) organization. Stay tuned!
- Part 1 – Improve endpoint user experience with Microsoft Endpoint Analytics: A first impression!
- Part 2 – Improve endpoint user experience with Microsoft Endpoint Analytics: Start-up Performance
- Part 3 – Improve endpoint user experience with Microsoft Endpoint Analytics: Proactive Remediation
- Part 4 – Improve endpoint user experience with Microsoft Endpoint Analytics: Recommended Software
- Part 5 – Improve endpoint user experience with Microsoft Endpoint Analytics: Application Reliability & Device Restarts
- Part 6 – Improve endpoint user experience with Microsoft Endpoint Analytics: 😀
