Part 2 – Improve user experience with Microsoft Endpoint Analytics: Startup Performance

My previous blog post was a brief introduction to Microsoft Endpoint Analytics, what it is and how it relates to Microsoft productivity score. In this second blog post I will cover the startup performance, one of the three core features of Endpoint Analytics. How do you gain insight into device setup, startup & sign-in times per individual- as well as per device model and overall system performance as part of Endpoint Analytics startup performance.
- Startup performance, help IT get users from power-on to productivity quickly without lengthy boot and sign in delays
- Proactive remediation scripting, fix common support issues before end-users notice issues
- Recommended software, recommendations for providing the best user experience
Now we have set up Endpoint Analytics we are ready to collect data and gain insights how your endpoints performing. Are they in a good shape and fine tuned to provide the best in class end-user experience? Perhaps they do…but as always there might be some room for improvements out there!
Startup Performance
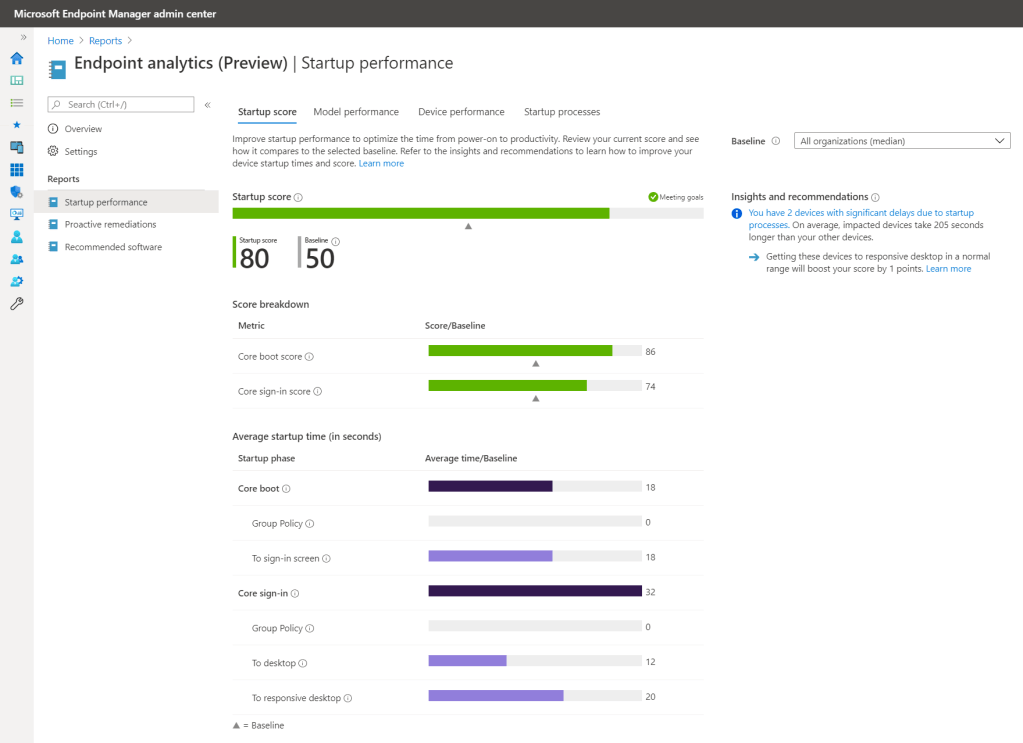
The startup performance score helps IT get users from power-on to productivity quickly, without lengthy boot and sign-in delays. The Startup score is a number between 0 and 100.
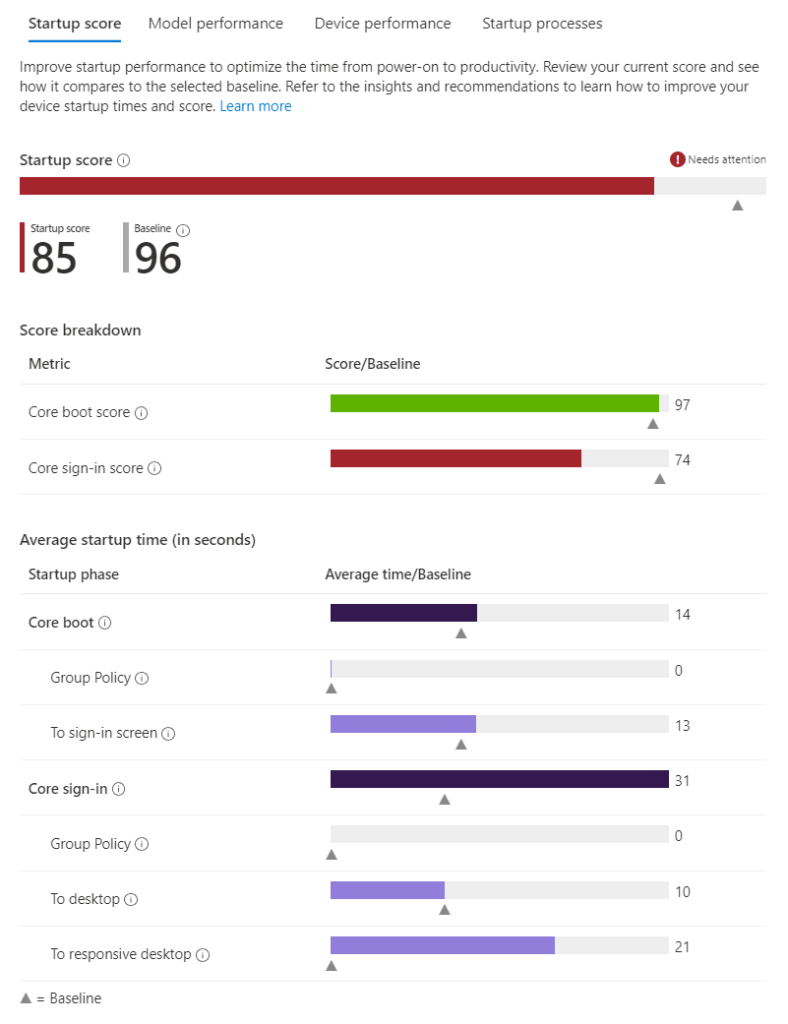
This score is a weighted average of Boot score and the Sign-in score, which are computed as follows:
- Boot score: Based on the time from power-on to sign in. We look at the last boot time from each device, excluding the update phase, then score it from 0 (poor) to 100 (exceptional). These scores are averaged to provide an overall tenant boot score.
- Sign-in score: Based on the time from when credentials have been entered until the user can access a responsive desktop (meaning the desktop has rendered and the CPU usage has fallen below 50% for at least 2 seconds). We look at the last sign-in time to each device, excluding first sign-ins or sign-ins immediately after a feature update, then score it from 0 (poor) to 100 (exceptional). These scores are averaged to provide an overall tenant boot score.
Insights
The Startup performance page also provides a prioritized list of Insights and recommendations, described in the following sections:
- Hard disk drives: Startup performance provides an insight on the number of devices on which the boot drive is a hard disk. Hard disk drives typically result in boot times three to four times longer than solid-state drives. We also report the expected improvement to start up performance you would gain by moving to solid-state drives.
Click through to see the list of devices that have hard disk drives. The recommended action is to upgrade these devices to solid-state drives.
- Group Policy: Startup performance provides an insight on the number of devices that have delays to boot and sign-in times caused by Group Policy. Clicking through takes you to the devices view. The view is sorted by Group Policy time, so you can see affected devices for further troubleshooting.
If you click through to a particular device, you can see its boot and sign-in history. The history helps you determine if the issue is a regression and when it might have occurred.
While there are many articles on how to optimize Group Policies performance, you may choose to migrate to cloud-management instead. Migrating to cloud-management allows you to use Intune security baselines and the soon-to-be-released Policy Analytics tool.
- Slow boot and sign-in times: Startup performance provides an insight on the number of devices with slow boot or sign-in times. A boot score or sign-in score of “0” means it’s slow. Clicking through takes you to the devices view. The devices are sorted by core boot time or core sign-in time respectively, so you can see affected devices for further troubleshooting.
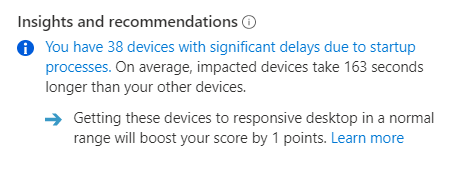
If you click through to a particular device, you can see its boot and sign-in history. The history helps you determine if the issue was a regression and when it might have occurred.
Reporting tabs
The Startup performance page has reporting tabs that provide support for the insights, including:
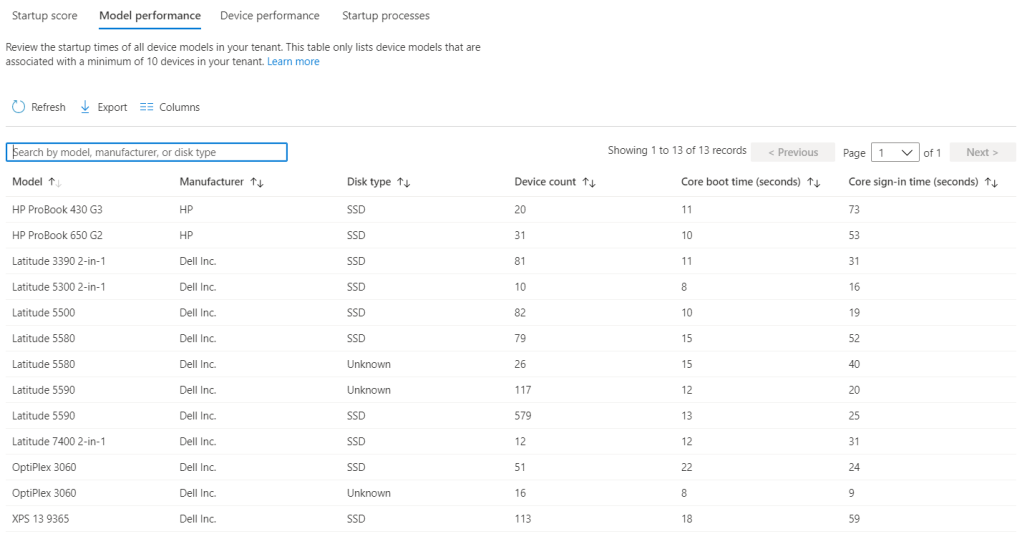
- Model performance: This tab provide you insights of the boot and sign-in performance by device model, which can help you identify if performance problems are isolated to particular models. This is useful and offers valuable insights as part of your hardware lifecycle management, in which not only economic depreciation but also performance indicators can play a role.
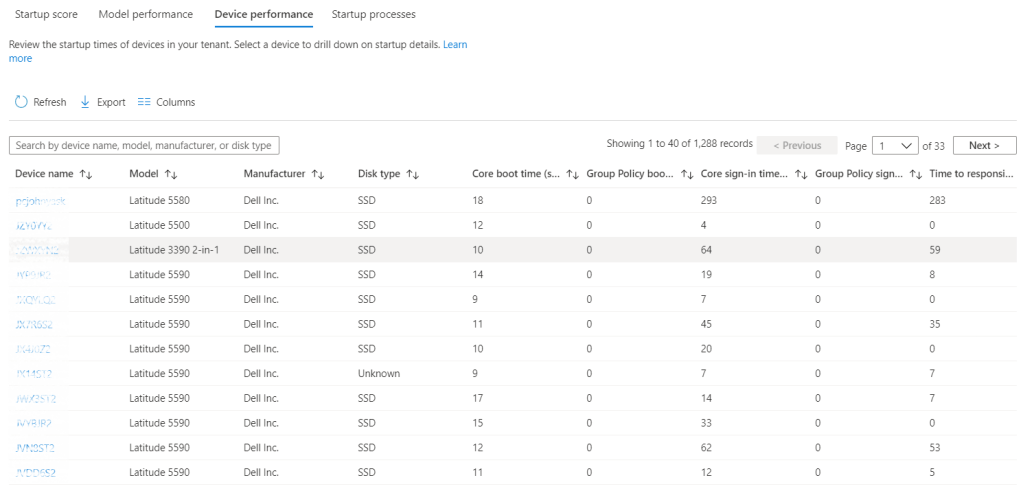
- Device performance: This tab provides boot and sign-in metrics for all your devices. You can sort by a particular metric (for example, GP sign-in time) to see which devices have the worst scores for that metric to help with troubleshooting. You can also search for a device by name. If you click through a device you can see its boot and sign-in history, which can help you identify if there was a recent regression. This is useful to determine and consider whether or not to re-provision a workplace.
Note! Based on these metrics we started a campaign to identify the top 10 bad performers of each category (core boot-, core sign-in time and responsive desktop) and proactively reach out to the end-users to replace their device. Their reactions were priceless!
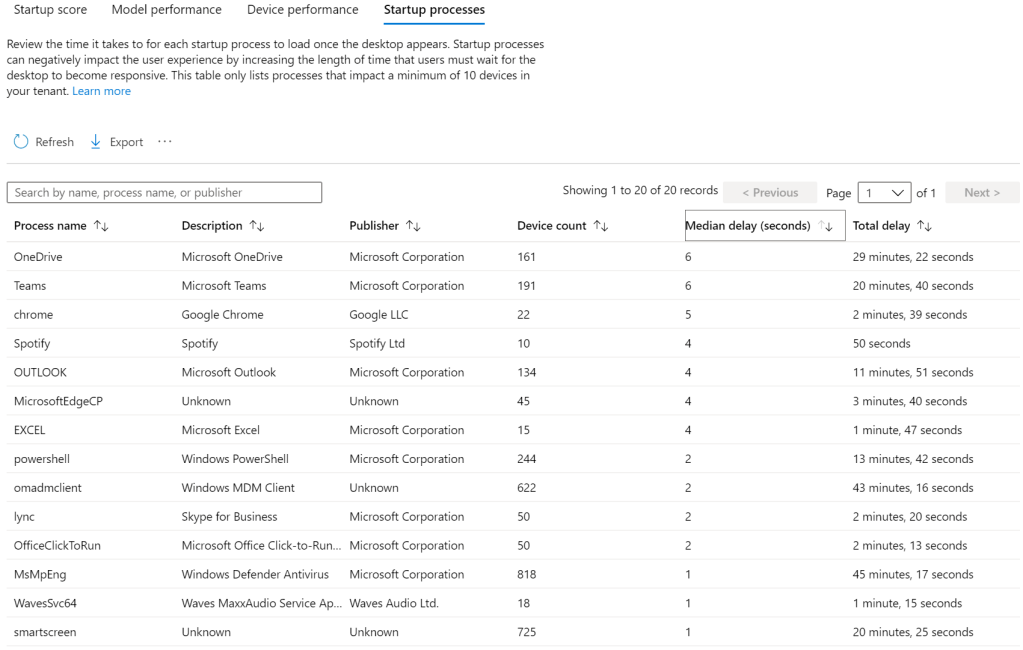
- Startup processes: Startup processes can negatively impact the user experience by increasing the length of time that users must wait for the desktop to become responsive. This tab (if visible; we’ve only flighted this to some of you as we are still developing this feature) will show you which processes are impacting the sign-in “time to responsive desktop” phase; that is – keeping the CPU above 50% after the desktop has rendered. The table only lists processes that impact a minimum of 10 devices in your tenant.
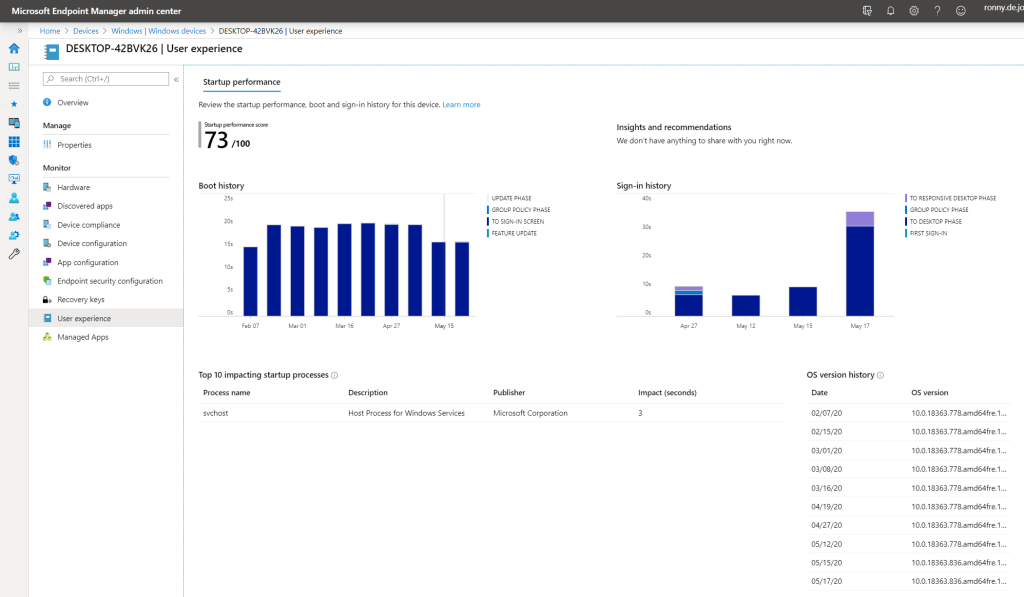
Device Startup performance Tab
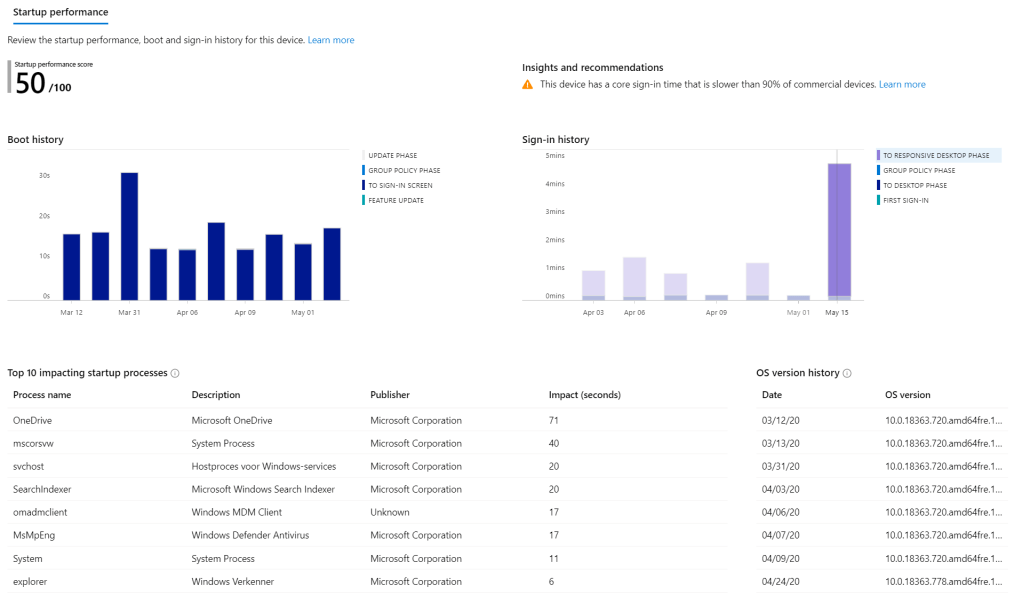
The device performance tab has the ability to click through to a particular device, you can see its boot and sign-in history as well as top impacting startup processes over a period of time. Furthermore it provides insight and recommendations on a per device level. This includes but its not limited to, recommendations of replacing certain hard-disk types (HDD) or striking deviations related to other system- or application components.
- Boot history: This tab provide insights regarding the boot history over time. Further a distinction can between the different phases of the start-up process. The history and phases helps you determine if the issue is a regression and when it might have occurred and what phases has been impacted.
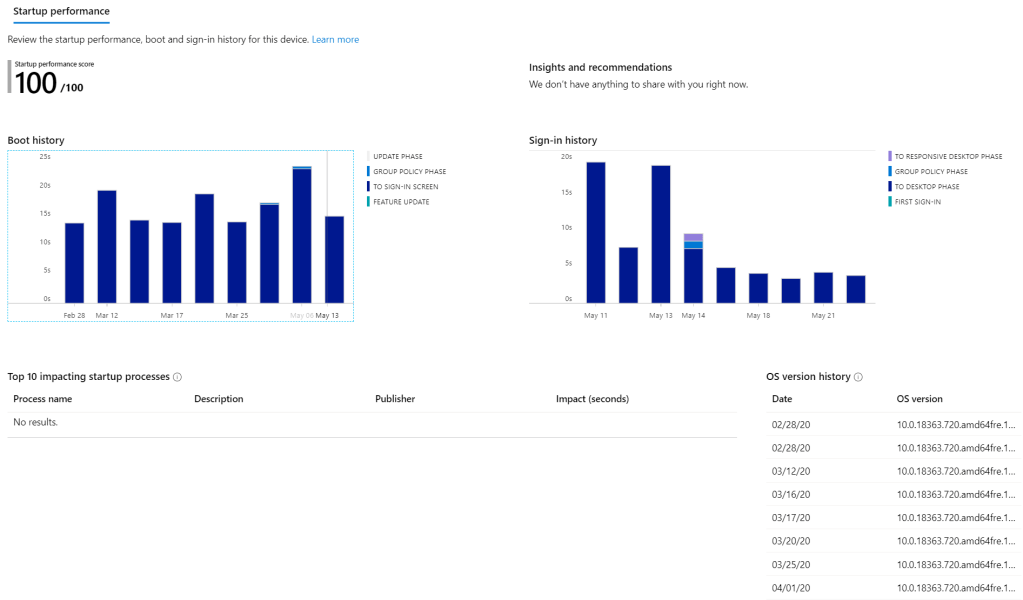
- Sign-in history: This tab provide insights regarding sign-in history over time. Further a distinction can between the different phases of the sign-in process. The history and phases helps you determine if the issue is a regression and when it might have occurred and what phases has been impacted.

- Top 10 impacting startup processes: This tab lets you see which processes negatively impacts your startup processes to a particular device and overall tenant score. This is extremely valuable because it allows concrete reconfiguration of startup processes in order to reduce or even eliminate the (negative) impact on the startup process, for individual or at organization level.
The endpoint analytics data can also be consulted directly via device context as part of the device properties. This is then described as User Experience.
Recap
With Endpoint Analytics we are able to denote user- and technology experience with a value and thereby make it transparent and measurable. Think of a targeted device refresh in case of boot performance issues or lengthy login times and remediate issues before they impacts your end-users. If you asked me Endpoint Analytics is a solution which you should not leave untouched!
In a series of blog posts I’ll show you the possibilities of endpoint analytics, where to start, how does it works and most important to get the most out of it for your end-users and (IT) organization. Stay tuned!
- Part 1 – Improve endpoint user experience with Microsoft Endpoint Analytics: A first impression!
- Part 2 – Improve endpoint user experience with Microsoft Endpoint Analytics: Startup Performance
- Part 3 – Improve endpoint user experience with Microsoft Endpoint Analytics: Proactive Remediation
- Part 4 – Improve endpoint user experience with Microsoft Endpoint Analytics: Recommended Software
- Part 5 – Improve user experience with Microsoft Endpoint Analytics: Application Reliability & Device Restarts
In my next blogpost I’ll go in to more details about recommended software and how to improve your organizations score. Making sure your devices are on Windows 10 and cloud services like Azure AD, Intune & Windows Autopilot are in place providing the best user experience.
Sources
- Microsoft Endpoint Analytics https://docs.microsoft.com/en-us/mem/configmgr/core/misc/user-experience-analytics-preview
