Part 1 – Improve your user experience with ‘Insight driven IT’ Endpoint Analytics: A first impression!

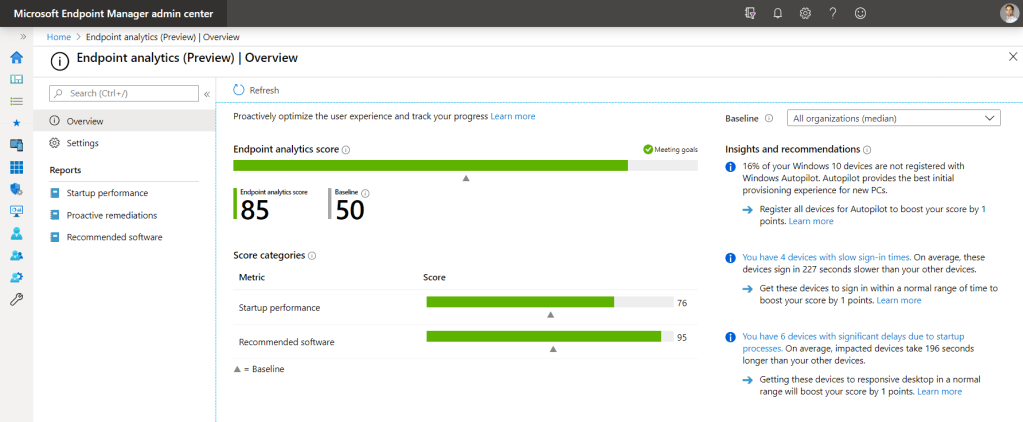
With Endpoint Analytics organizations are able to improve user productivity and reducing IT costs by giving you insights about device setup, startup- & sign-in times and overall system performance. Furthermore it provides intelligent endpoint management recommendations which enables IT to optimize the end-user experience with proactive support and detect regressions to the user experience by assessing user impact of configuration changes.
This initial release of Microsoft Endpoint Analytics focuses on three areas:
- Startup performance, help IT get users from power-on to productivity quickly without lengthy boot and sign in delays
- Proactive remediation scripting, fix common support issues before end-users notice issues
- Recommended software, recommendations for providing the best user experience
In a series of blog posts I’ll show you the possibilities of endpoint analytics, where to start, how does it works and most important to get the most out of it for your end-users and (IT) organization. Stay tuned!
- Part 1 – Improve user experience with Microsoft Endpoint Analytics: A first impression!
- Part 2 – Improve user experience with Microsoft Endpoint Analytics: Start-up Performance
- Part 3 – Improve user experience with Microsoft Endpoint Analytics: Proactive Remediation
- Part 4 – Improve user experience with Microsoft Endpoint Analytics: Recommended Software
- Part 5 – Improve user experience with Microsoft Endpoint Analytics: Application Reliability & Device Restarts
The bigger picture
Endpoint Analytics is part of Microsoft Endpoint Manager where the score is an integral part of Technology experience, which rolls-up into Microsoft Productivity Score.
Productivity Score helps organizations transform how work gets done with insights about how people use Microsoft 365 and the technology experiences that support them. The score reflects your organization’s performance against employee and technology experience measures and compares your score with organizations like yours.

To me Microsoft Productivity Score is a breakthrough and a leading example how an emerging landscape of workplace management will change. Data-driven insights increases the added value of IT where end-users enabled to be more productive. The combination of employee experience together with technology driven insights is an extremely powerful combination, all the more it’s measured from an end-user perspective.
Microsoft productivity score is a linking factor between IT, business and end users and offers opportunities to take workplace management to unprecedented heights.
Endpoint Analytics overview
It’s not uncommon for end users to experience long boot times or facing other disruptions. These issues and other end-user experience problems persist because IT doesn’t have much visibility into the end-user experience. These disruptions can be due to a combination of legacy hardware (use of HDD), software configurations that aren’t optimized for the end-user experience or issues caused by configuration changes and updates.

Generally, the only visibility into these issues come from a slow costly support channel that doesn’t usually provide clear information about what needs to be optimized. It’s not only IT support bearing the cost of these problems. The time information workers spend dealing with issues is also costly. Performance, reliability, and support issues that reduce user productivity can have a large impact on an organization’s bottom line as well.
Getting started
Assuming all prerequisites are in-place enabling Endpoint Analytics is quite easy and straight forward to set up. The onboarding slightly differs for Endpoint Manager (aka Intune) managed devices over devices which are managed by Endpoint Configuration Manager.
Start gathering data
- If you are enrolling Intune managed devices only, skip to the Onboard in the Endpoint analytics portal section.
- If you’re enrolling devices that are managed by Configuration Manager, you’ll need to do the following steps:
- Enable Endpoint analytics data collection in Configuration Manager (Client settings)
- Enable data upload in Configuration Manager (Cloud services)
- Onboard in the Endpoint analytics portal
To keep track of the onboarding process consult UXAnalyticsUploadWorker.log which can be found in .\Program Files\Microsoft Configuration Manager\Logs at your Endpoint Configuration Manager server.
Note: you must be on Microsoft Endpoint Configuration Manager 2002 or higher.

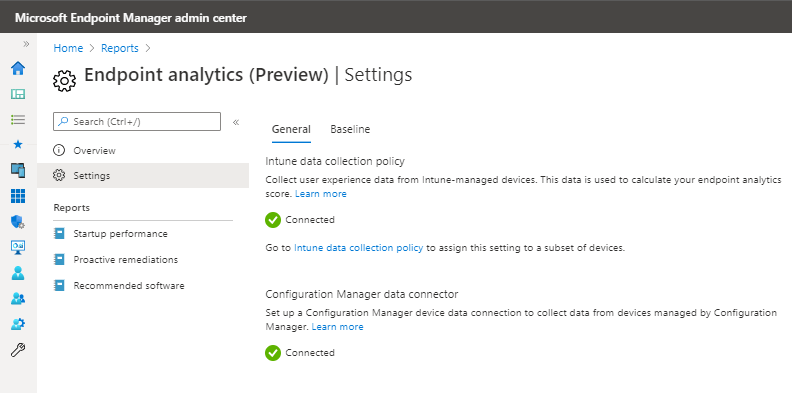
Onboard in the Endpoint analytics portal
Onboarding from the Endpoint analytics portal is required for both Endpoint Configuration Manager and Endpoint Manager managed devices.

- Go to
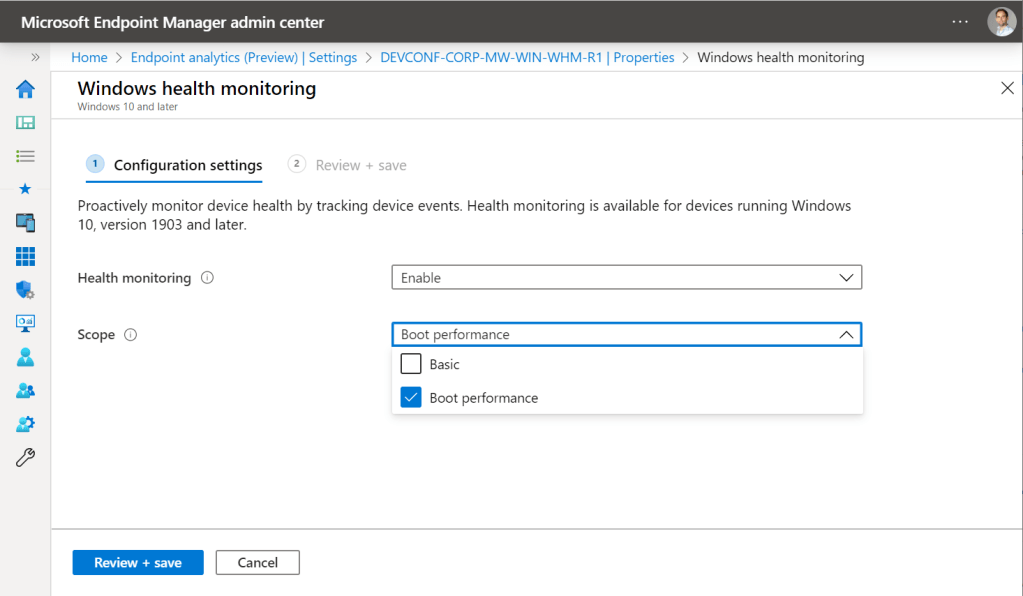
https://endpoint.microsoft.com/#blade/Microsoft_Intune_Enrollment/UXAnalyticsMenu - Click Start. This will automatically assign a configuration profile to collect boot performance data from all eligible devices. You can change assigned devices later. It may take up to 24 hours for startup performance data to populate from your Endpoint Manager enrolled devices after they reboot.
- For more information about common issues, see Troubleshooting startup performance device enrollment.
By default, this policy is assigned to “All Devices” when you Start Endpoint analytics. However, you can change the assignment at any time to a subset of devices or no devices at all.
Once devices have been successfully configured for data collection, they must be restarted after data collection has been enabled, and you must then wait up to 24 hours after for the device to show up in the device performance tab.
If your device has been successfully configured for data collection, has subsequently restarted, and after 24 hours you are still not seeing it, then it may be that the device can’t reach Microsoft collection endpoints. This issue may happen if your company uses a proxy server and the endpoints have not been enabled in the proxy. For more information, see Troubleshooting endpoints.
Endpoint Analytics Data flow
The illustration below shows how required functional data flows from individual devices through Microsoft’s data services, transient storage, and to your tenant. Data flows through existing enterprise pipelines without reliance on Windows diagnostic data.
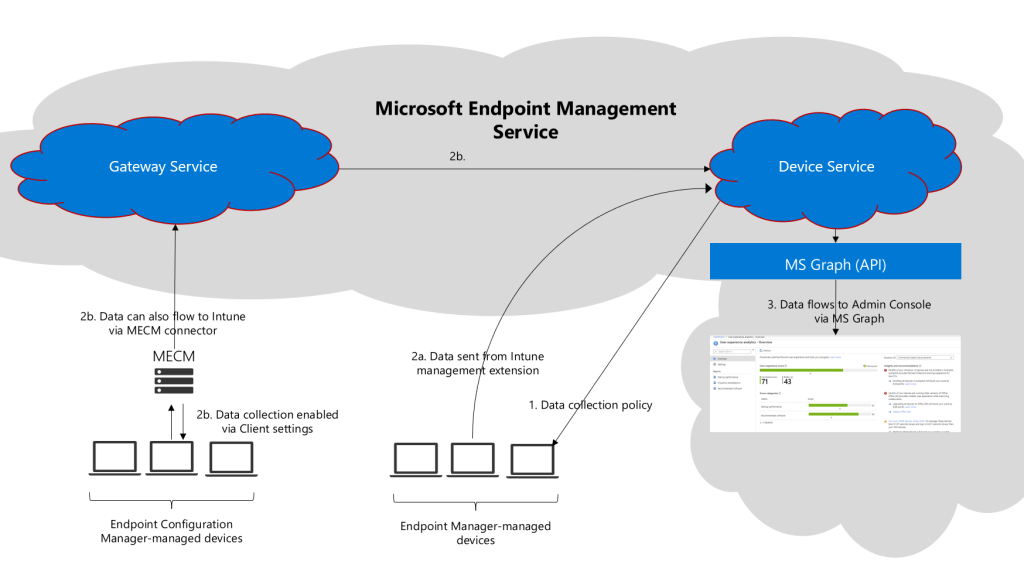
- Configure the Intune data collection policy for enrolled devices. By default, this policy is assigned to “All Devices” when you Start Endpoint analytics. However, you can change the assignment at any time to a subset of devices or no devices at all.
- Devices send required functional data.
- 2a For Intune devices with the assigned policy, data is sent from the Intune management extension. For more information, see requirements.
- 2b For Configuration Manager managed devices, data can also flow to Microsoft Endpoint Management through the ConfigMgr connector. The ConfigMgr connector is cloud attached. It only requires connection to an Intune tenant, not turning on co-management.
- The Microsoft Endpoint Management service processes data for each device and publishes the results for both individual devices and organizational aggregates in the admin console using MS Graph APIs.
The data required to compute the startup score for a device is generated during boot time. Depending on power settings and user behavior, it may take weeks after a device has been correctly assigned the policy to show the startup score on the admin console.
The average latency end to end is about 12 hours and is gated by the time it takes to do the daily processing. All other parts of the data flow are near-real-time.
Recap
With Endpoint Analytics we are able to denote user- and technology experience with a score and thereby make it transparent and measurable for your organization. Think of a targeted device refresh in case of boot performance issues and remediate issues before they impacts your end-users.
The current release is a first generation with a set of functionalities that will be further expanded in the future. Think of application health (somewhat similar to Windows Analytics) and reboot analysis. Being able to scope Endpoint Analytics at department level is also one of the expected possibilities.
Endpoint Analytics is available for those having a Microsoft Intune license (Enterprise Mobility + Security E3) and requires Windows E3 SKU for using Proactive Remediation (remediation scripting).
Despite the fact that existing solutions are already available, which might more mature in some areas, I believe Endpoint Analytics is a solution which forms a more than welcome enrichment of the Microsoft 365 portfolio! The platform approach and integration Microsoft 365 ecosystem makes Endpoint Analytics a solution which should not left untouched!
From here you’re just one click away from Endpoint Analytics 😉http://aka.ms/endpointanalytics
In my next blogpost I’ll go in to more details about device setup, startup- & sign-in times and overall system performance as part of Endpoint Analytics startup performance.
