Improved MDM diagnostics from Windows 10 Insider Preview #16232
Note: the content in this blog post may subject to change as it’s based on Windows 10 Insider Preview build 16232/16237.
In the early days of Windows 8.x modern management made it’s appearance but due it’s limitations at that time not widely adopted.
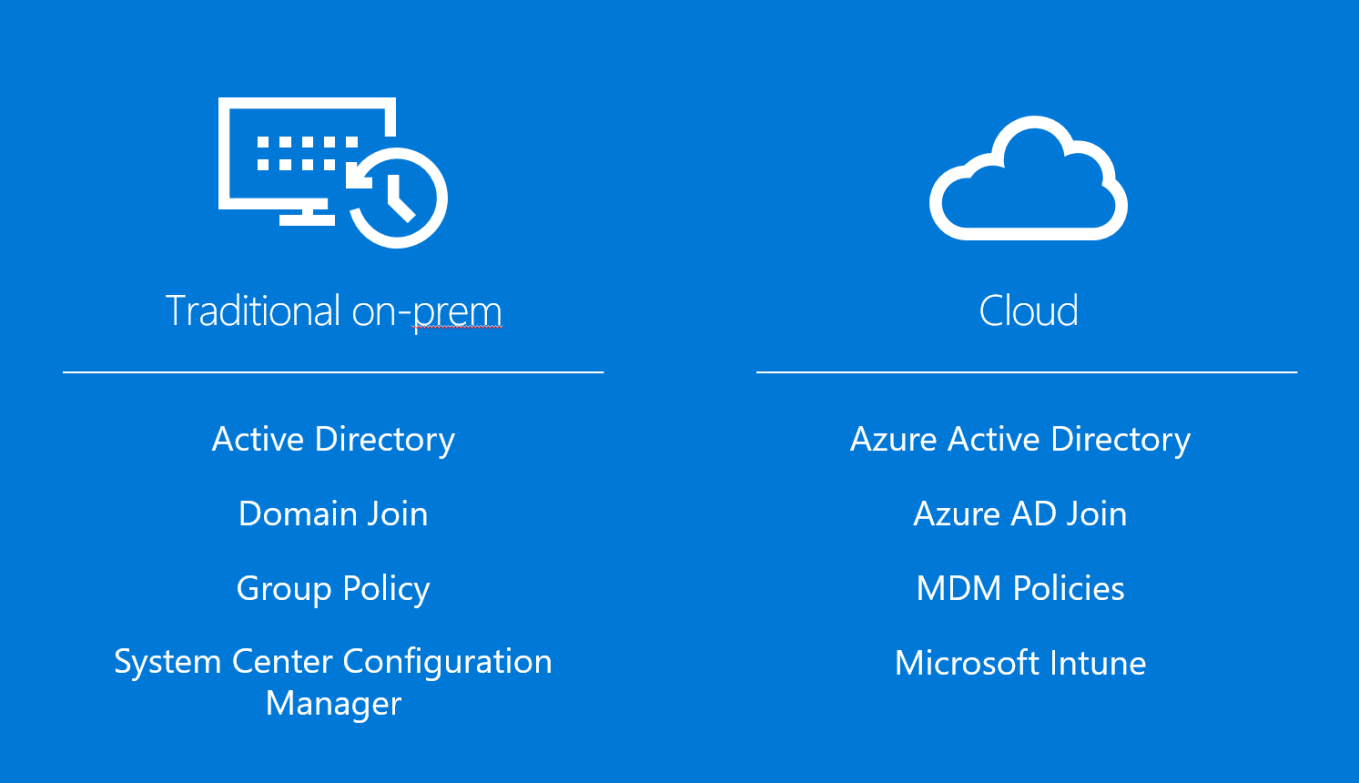
The introduction of Windows 10 as the cloud OS with tight integration of Azure AD changed this rapidly. Combined with configuration service provider (CSP) modern management provides increased capabilities and therefore closing the gap with traditional management.
Another often-heard challenge of modern management is the troubleshooting part. This can sometimes be challenging as it is experienced as a black box. Common tools (e.g. Event Viewer, PowerShell, WMI) are sometimes cryptic and thus challenging to interpret, until today!

To illustrate the ease of troubleshooting (low entry), we configured a custom policy by Microsoft Intune which configures Windows Defender Application Guard (currently in preview) and check the process of the policy being applied on our endpoint .

Once assigned the policy in Microsoft Intune we triggered a policy refresh cycle.
Updated interface

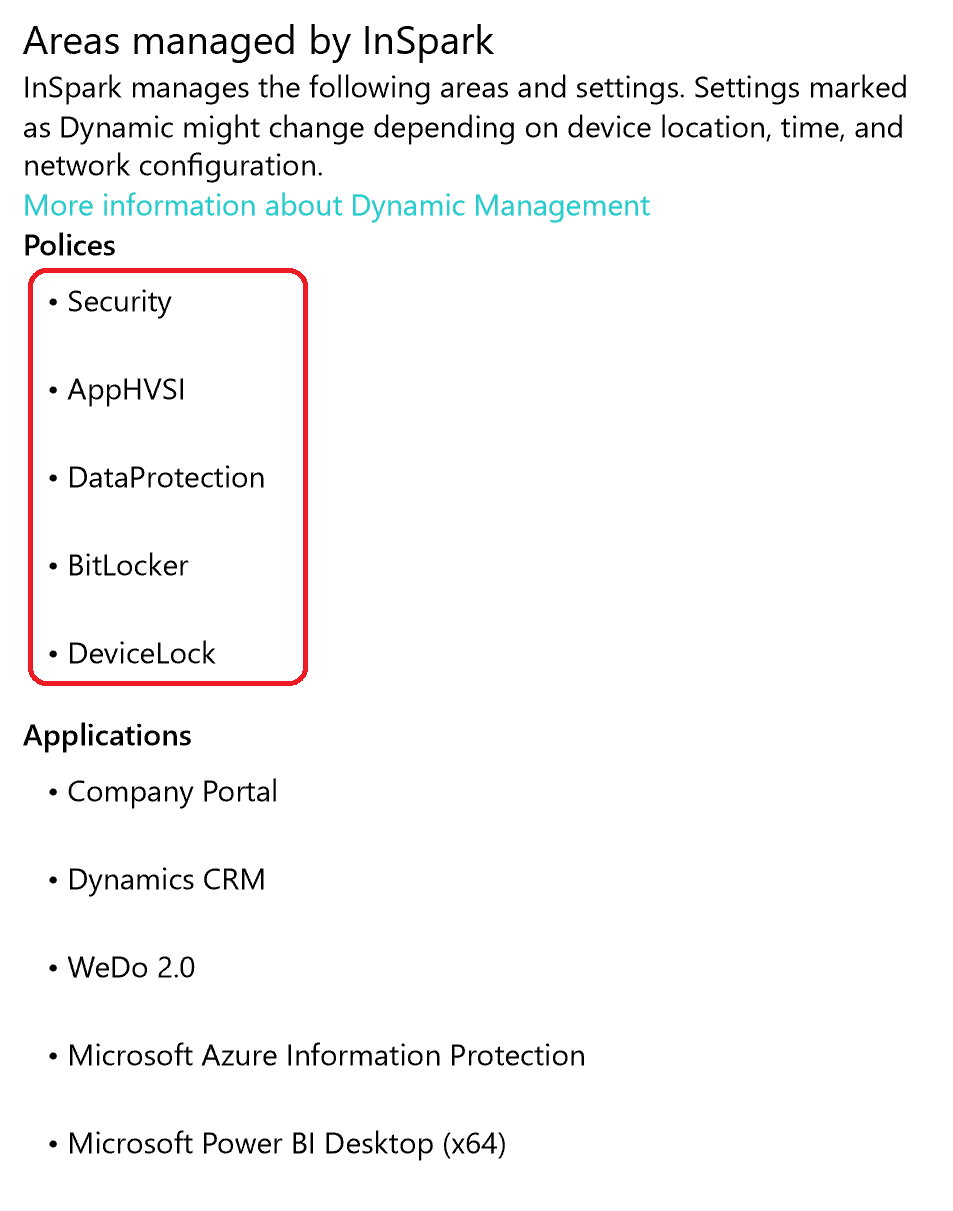
In the updated GUI we can now determine which policy categories are configured, including our Windows Defender Application Guard (AppHVSI) policy. Besides the outline of the policy categories we can also determine the installed applications.
 |
 |
Management Diagnostic log files
The updated GUI goes beyond just displaying what is configured/applied and provides the ability drill down to our MDM configuration. The MDM configuration can be exported in a management log file which is exported in HTML format to C:\Users\Public\Documents\MDMDiagnostics\MDMDiagReport.html

The MDM diagnostic log file provides general information of your system. However the most interesting part is yet to come.

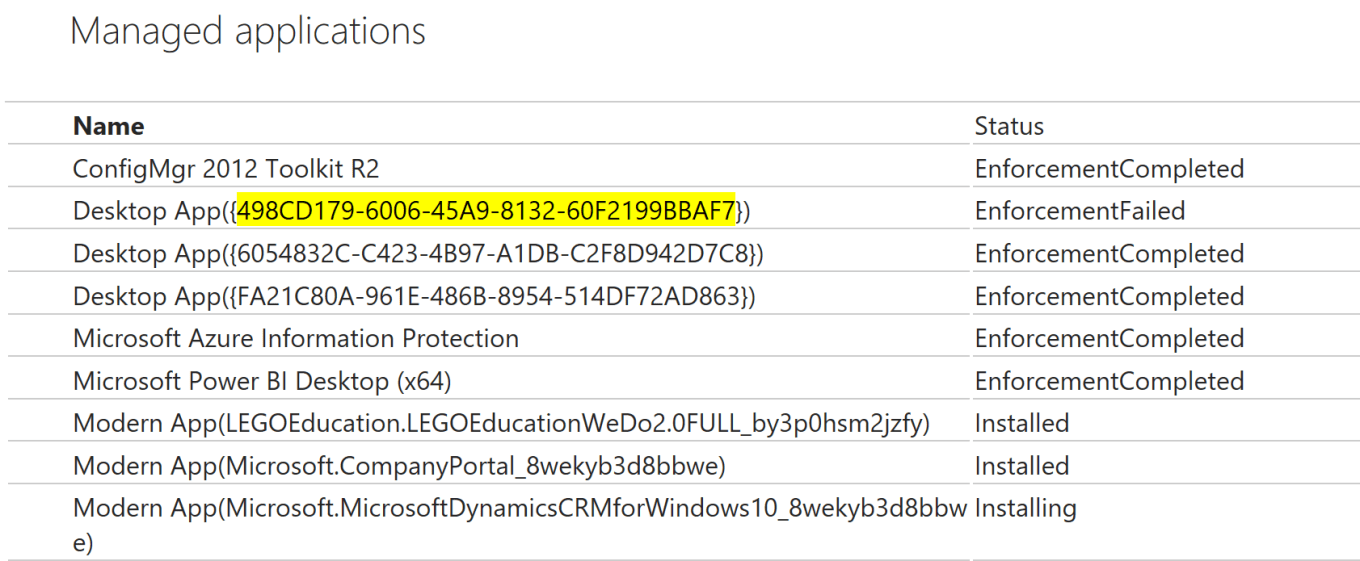
First of all it provides insights of the configuration sources and resource (CSPs) and whether it’s a device- or user based policy. The Resource section correlates to the various policies and installed apps. I highlighted a guid which correlates to an installed application.

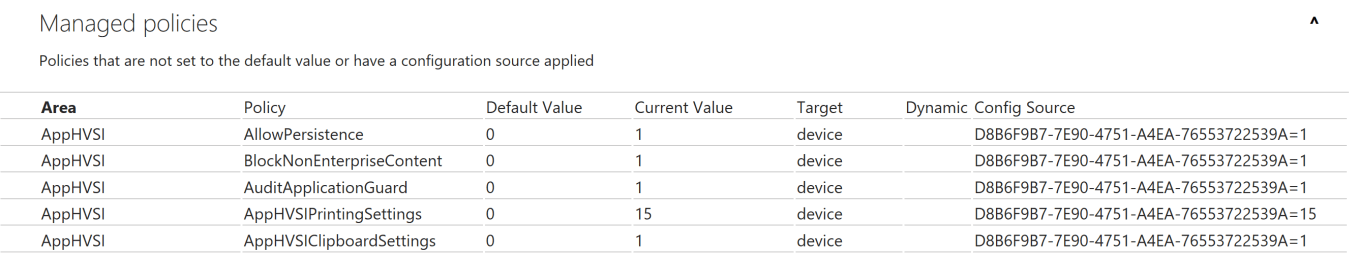
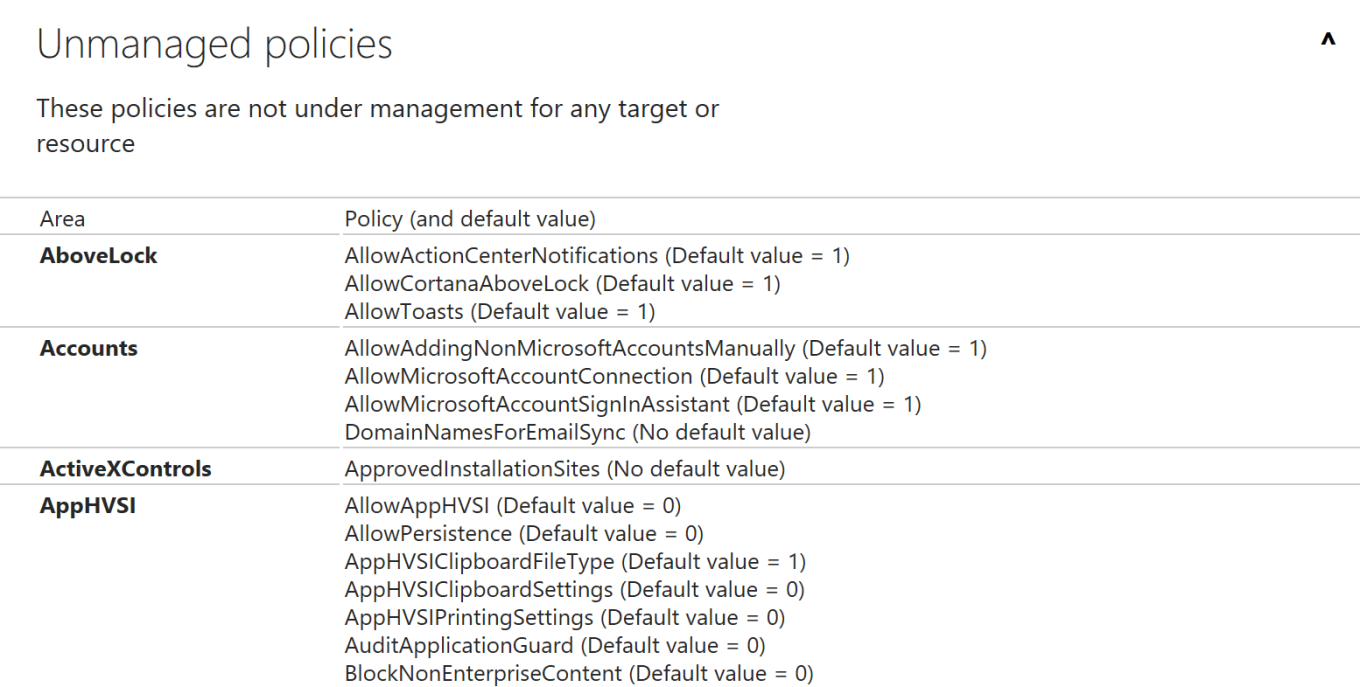
Further it provides a detailed list of which policy categories are deployed by your MDM solution. These categories are listed in the updated interface I mentioned before. Further this section provides the detailed configuration of your policies.
In our scenario we deployed Windows Defender Application Guard policy. It shows you the policy area, default value, current value and whether it’s a device- or user based policy. It confirms the custom Windows Defender Application Guard Policy has been landed and successfully applied.
When looking under the hood we’ve the confirmation here too, Windows Defender Application Guard is configured properly. And mentioned earlier you’ll find the policy categories once again.
HKEY_LOCAL_MACHINE\SOFTWARE\Microsoft\PolicyManager\current\device\AppHVSI

Complementary to the Windows Defender Application Guard CSP configuration you can keep track of the group policy (backed ADMX) equivalent.

Installed Applications
As mentioned before the MDM diagnostic log file also includes the list of installed applications through MDM channel.
Summary
The updated interface in this Windows 10 preview build is a simple as ingenious extension and help us to get useful insights to troubleshoot your modern management end-points.
Sources
Introduction to configuration service providers (CSPs) for IT pros
WindowsDefenderApplicationGuard CSP
https://docs.microsoft.com/en-us/windows/client-management/mdm/windowsdefenderapplicationguard-csp
Categories

MDM solutions are the best which are using by many companies according to their requirement under well defined MDM solutions under the BYOD, CYOD or COPE.